Edit chart
Loading graph
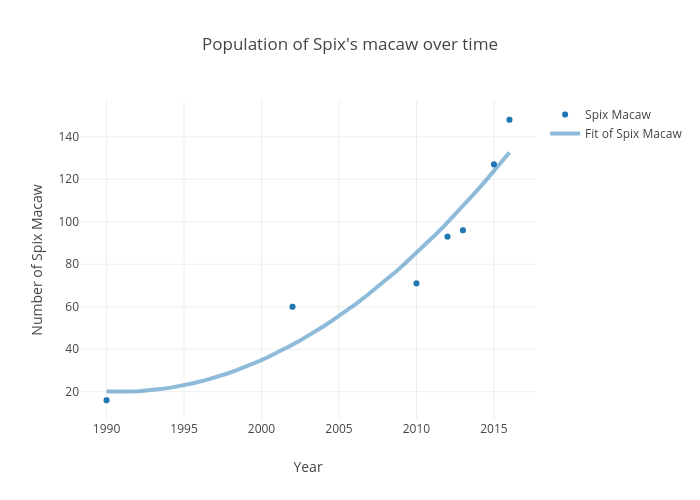
Jenjen123456's interactive graph and data of "Population of Spix's macaw over time" is a scatter chart, showing Spix Macaw; with Year in the x-axis and Number of Spix Macaw in the y-axis.. The x-axis shows values from 1988.4607508532424 to 2017.5392491467576. The y-axis shows values from 7.717244950802693 to 156.2827550491973.