Edit chart
Loading graph
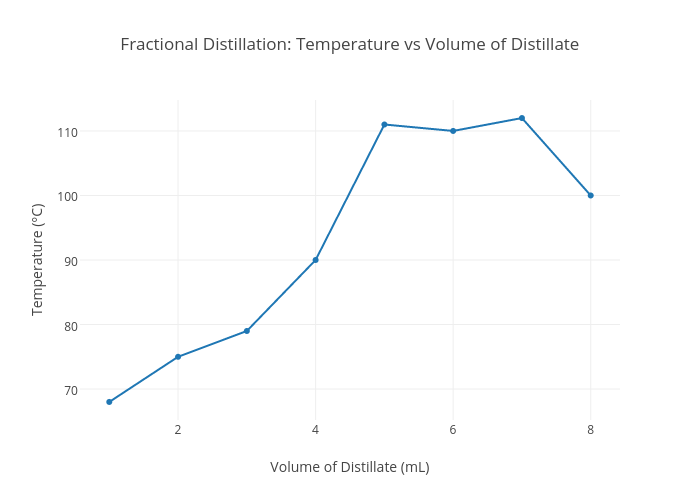
Jbeard99's interactive graph and data of "Fractional Distillation: Temperature vs Volume of Distillate" is a scatter chart, showing y vs ; with Volume of Distillate (mL) in the x-axis and Temperature (°C) in the y-axis.. The x-axis shows values from 0.5740599593495932 to 8.425940040650406. The y-axis shows values from 65.20292363916138 to 114.79707636083862.