Edit chart
Loading graph
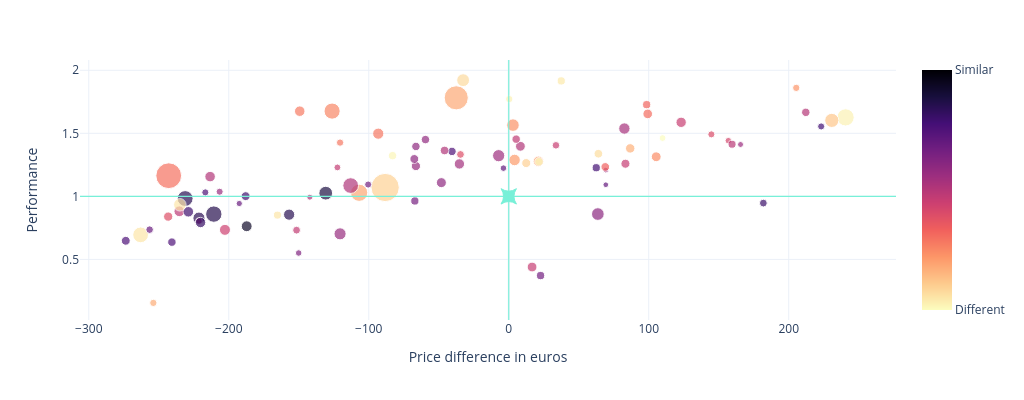
Janpecka's interactive graph and data of "Performance vs Price difference in euros" is a scatter chart; with Price difference in euros in the x-axis and Performance in the y-axis.. The x-axis shows values from -306.27923707572177 to 276.6520758659026. The y-axis shows values from 0.0192185231160876 to 2.0816564986826034.