Edit chart
Loading graph
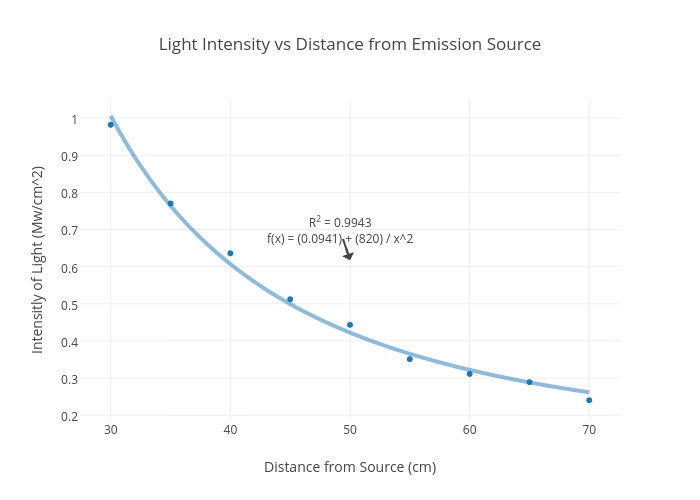
Jamesbremner's interactive graph and data of "Light Intensity vs Distance from Emission Source" is a scatter chart, showing Col2 vs Col2 - fit; with Distance from Source (cm) in the x-axis and Intensitly of Light (Mw/cm^2) in the y-axis.. The x-axis shows values from 27.588749007598956 to 72.41125099240104. The y-axis shows values from 0.1876850526839401 to 1.0486272178174223. This visualization has the following annotation: R2 = 0.9943f(x) = (0.0941) + (820) / x^2