Edit chart
Loading graph
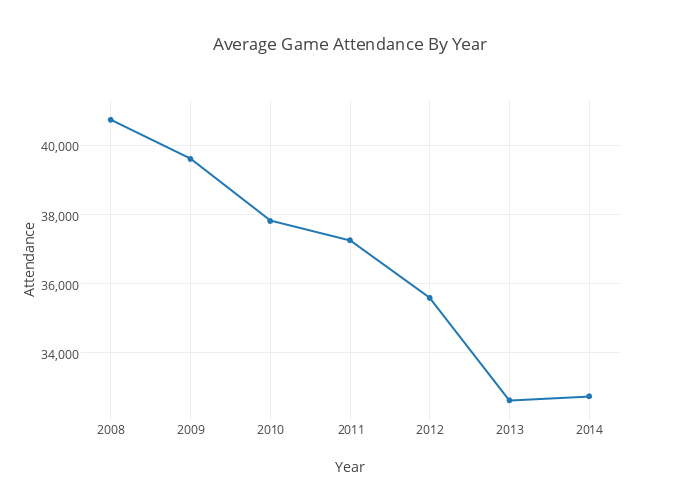
Jacobfeiger's interactive graph and data of "Average Game Attendance By Year" is a scatter chart, showing Col2; with Year in the x-axis and Attendance in the y-axis.. The x-axis shows values from 2007.6270218839202 to 2014.3729781160798. The y-axis shows values from 32034.135416666668 to 41334.864583333336.