Edit chart
Loading graph
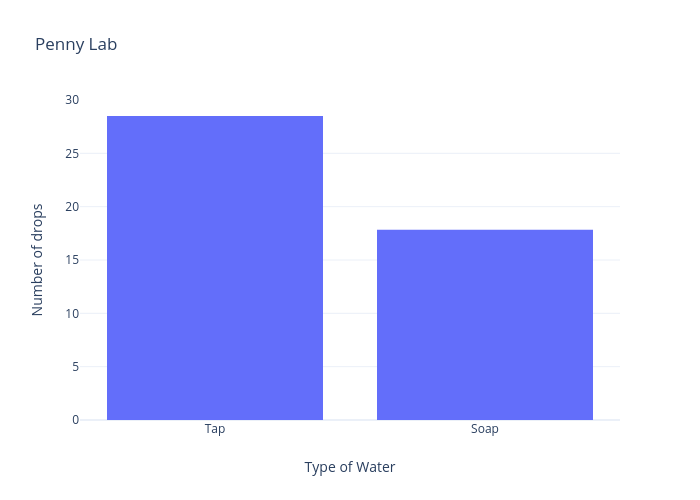
Iyanit's interactive graph and data of "Penny Lab " is a bar chart; with Type of Water in the x-axis and Number of drops in the y-axis.. The x-axis shows values from -0.5 to 1.5. The y-axis shows values from 0 to 30.