Edit chart
Loading graph
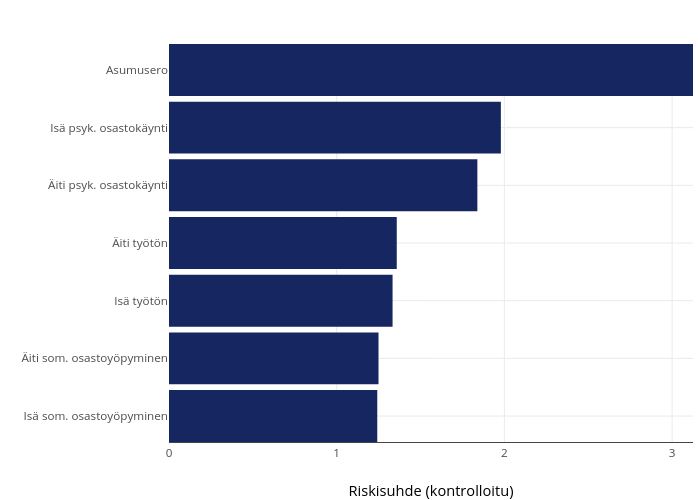
Itla's interactive graph and data is a bar chart; with Riskisuhde (kontrolloitu) in the x-axis. The x-axis shows values from 0 to 3.1247298221925. The y-axis shows values from 0.55 to 7.45.