Edit chart
Loading graph
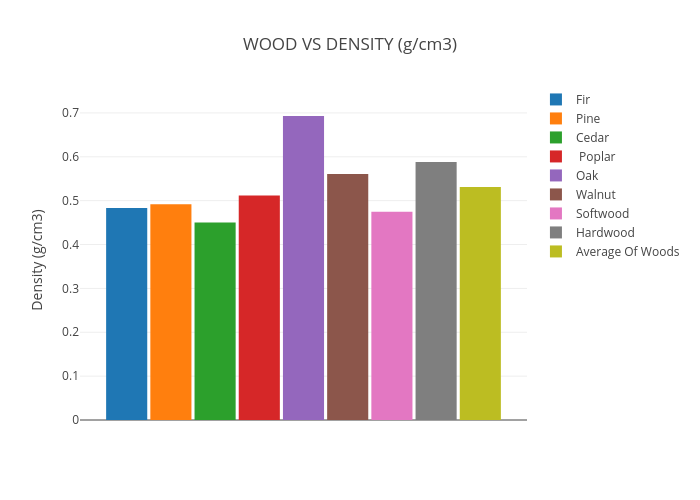
Ig021504's interactive graph and data of "WOOD VS DENSITY (g/cm3)" is a bar chart, showing Fir, Pine, Cedar, Poplar, Oak, Walnut, Softwood, Hardwood, Average Of Woods ; with Wood Tested in the x-axis and Density (g/cm3) in the y-axis.. The x-axis shows values from -0.5 to 0.5. The y-axis shows values from 0 to 0.7294736842105263.