Edit chart
Loading graph
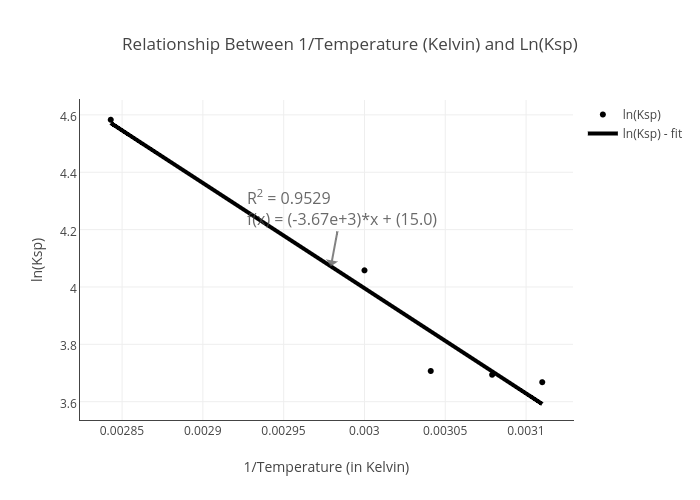
Happy_snoopy's interactive graph and data of "Relationship Between 1/Temperature (Kelvin) and Ln(Ksp)" is a scatter chart, showing ln(Ksp) vs ln(Ksp) - fit; with 1/Temperature (in Kelvin) in the x-axis and ln(Ksp) in the y-axis.. The x-axis shows values from 0.002826789639806907 to 0.003126210360193093. The y-axis shows values from 3.536230388879442 to 4.650447705545368. This visualization has the following annotation: R2 = 0.9529f(x) = (-3.67e+3)*x + (15.0)