Edit chart
Loading graph
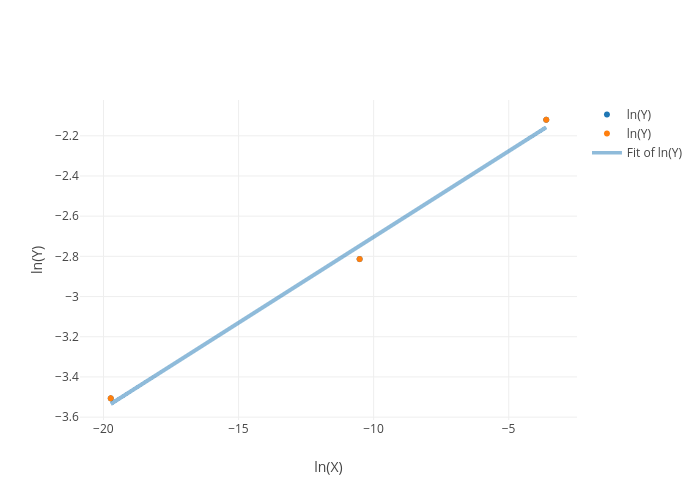
Hamid1's interactive graph and data of "ln(Y) vs ln(X)" is a scatter chart, showing ln(Y) vs ln(Y); with ln(X) in the x-axis and ln(Y) in the y-axis.. The x-axis shows values from -20.7090168481209 to -2.6329156248790992. The y-axis shows values from -3.613741340731947 to -2.032083696477534.