Edit chart
Loading graph
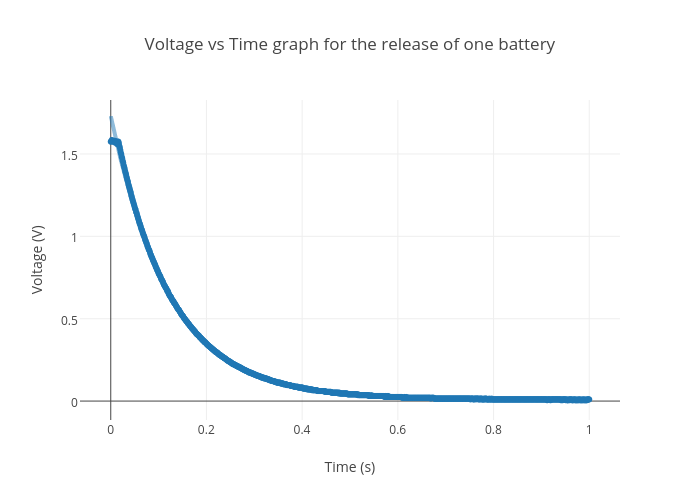
Hadiono's interactive graph and data of "Voltage vs Time graph for the release of one battery" is a scatter chart, showing Col2 vs Col2 - fit; with Time (s) in the x-axis and Voltage (V) in the y-axis.. The x-axis shows values from -0.059414652218208776 to 1.0594146522182089. The y-axis shows values from -0.10456689025174498 to 1.827133734091816.