Edit chart
Loading graph
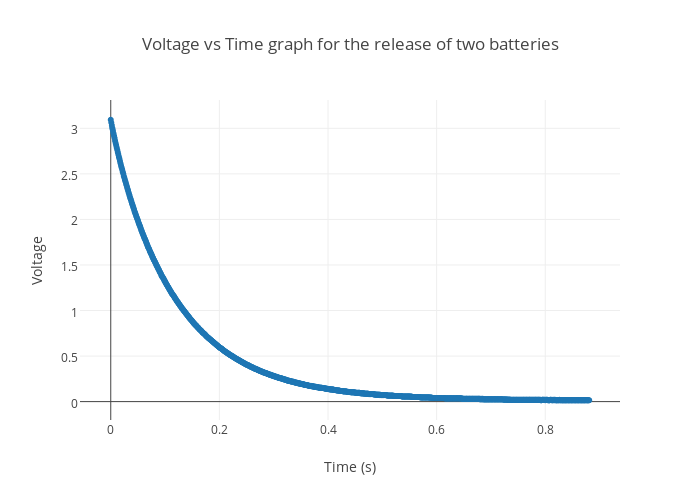
Hadiono's interactive graph and data of "Voltage vs Time graph for the release of two batteries" is a scatter chart, showing Col2 vs Col2 - fit; with Time (s) in the x-axis and Voltage in the y-axis.. The x-axis shows values from -0.05234430860424193 to 0.9333443086042419. The y-axis shows values from -0.18198878107944205 to 3.290988781079442.