Edit chart
Loading graph
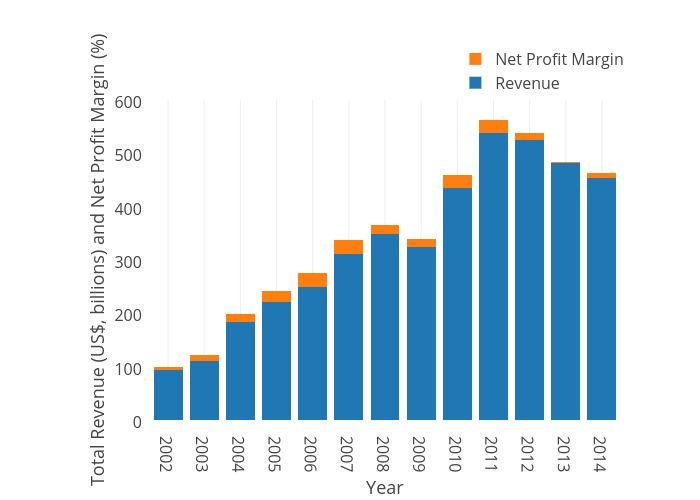
Froth.flotation's interactive graph and data of "Total Revenue (US$, billions) and Net Profit Margin (%) vs Year" is a stacked bar chart, showing Revenue vs Net Profit Margin; with Year in the x-axis and Total Revenue (US$, billions) and Net Profit Margin (%) in the y-axis.. The x-axis shows values from 2001.5 to 2014.5. The y-axis shows values from 0 to 600.