Edit chart
Loading graph
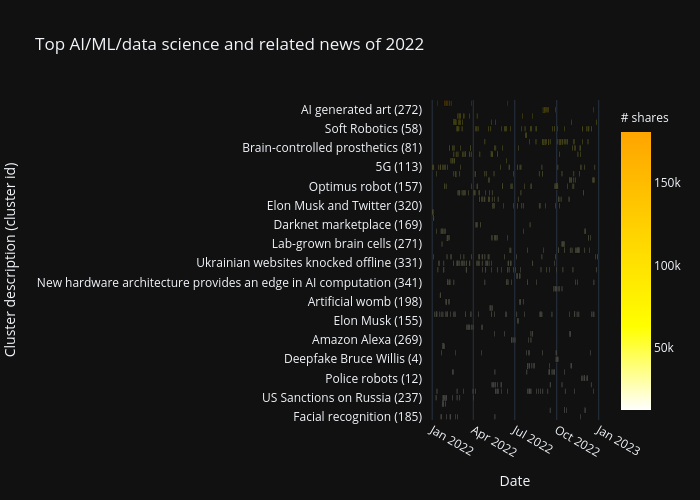
Fredrik's interactive graph and data of "Top AI/ML/data science and related news of 2022" is a bar chart; with Date in the x-axis and Cluster description (cluster id) in the y-axis.. The x-axis shows values from 0 to 0. The y-axis shows values from 0 to 0.