Edit chart
Loading graph
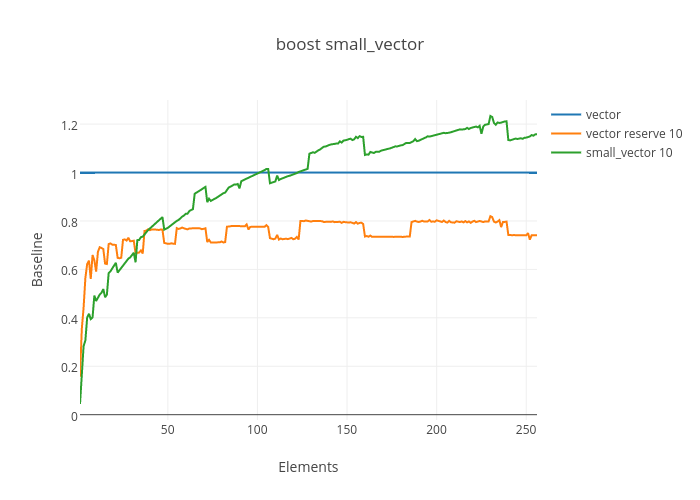
Enhex's interactive graph and data of "boost small_vector" is a line chart, showing vector, vector reserve 10, small_vector 10; with Elements in the x-axis and Baseline in the y-axis.. The x-axis shows values from 1 to 256. The y-axis shows values from -0.021961977777777773 to 1.2996295777777778.