Edit chart
Loading graph
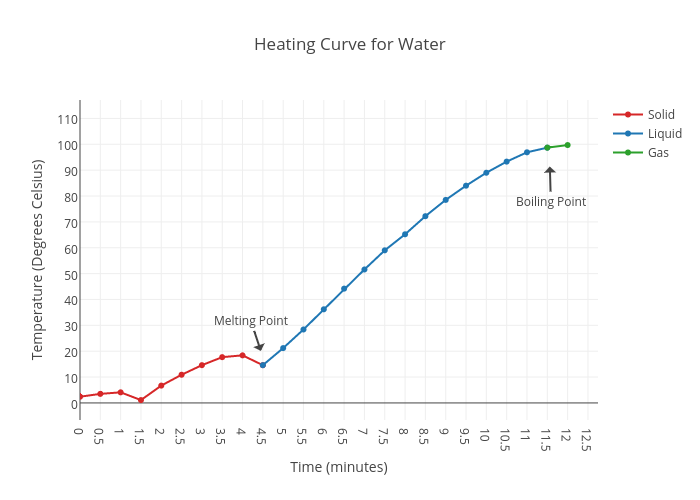
Emilyhaley's interactive graph and data of "Heating Curve for Water" is a line chart, showing Solid, Liquid, Gas; with Time (minutes) in the x-axis and Temperature (Degrees Celsius) in the y-axis.. The x-axis shows values from 0 to 12.747809152872444. The y-axis shows values from -6.6 to 117.12309121909634. This visualization has the following annotations: Melting Point; Boiling Point