Edit chart
Loading graph
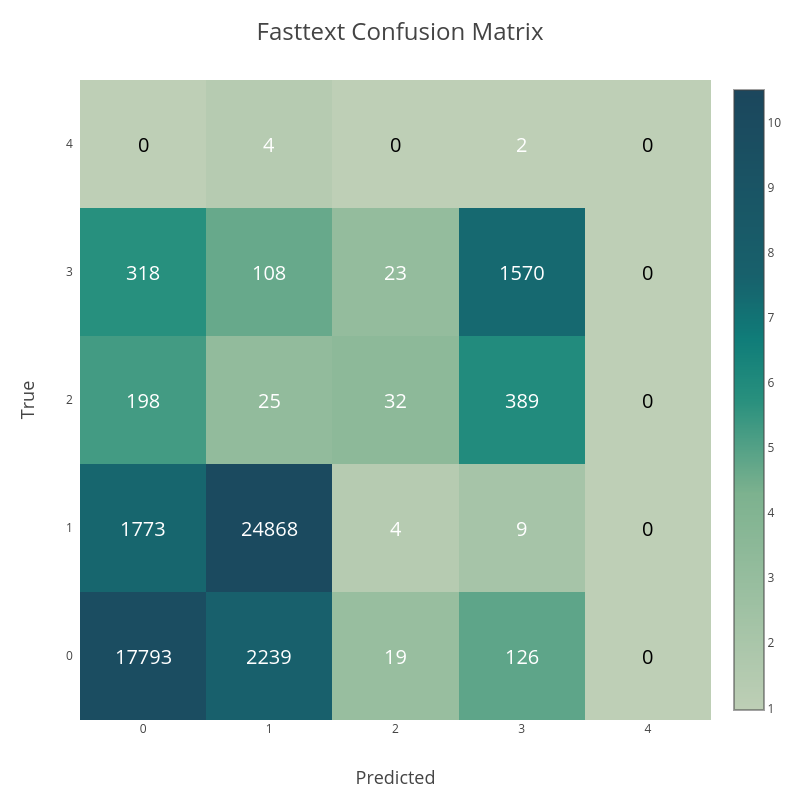
Earlynr's interactive graph and data of "Fasttext Confusion Matrix" is a heatmap; with Predicted in the x-axis and True in the y-axis.. The x-axis shows values from -0.5 to 4.5. The y-axis shows values from -0.5 to 4.5. This visualization has the following annotations: 17793; 2239; 19; 126; 0; 1773; 24868; 4; 9; 0; 198; 25; 32; 389; 0; 318; 108; 23; 1570; 0; 0; 4; 0; 2; 0