Edit chart
Loading graph
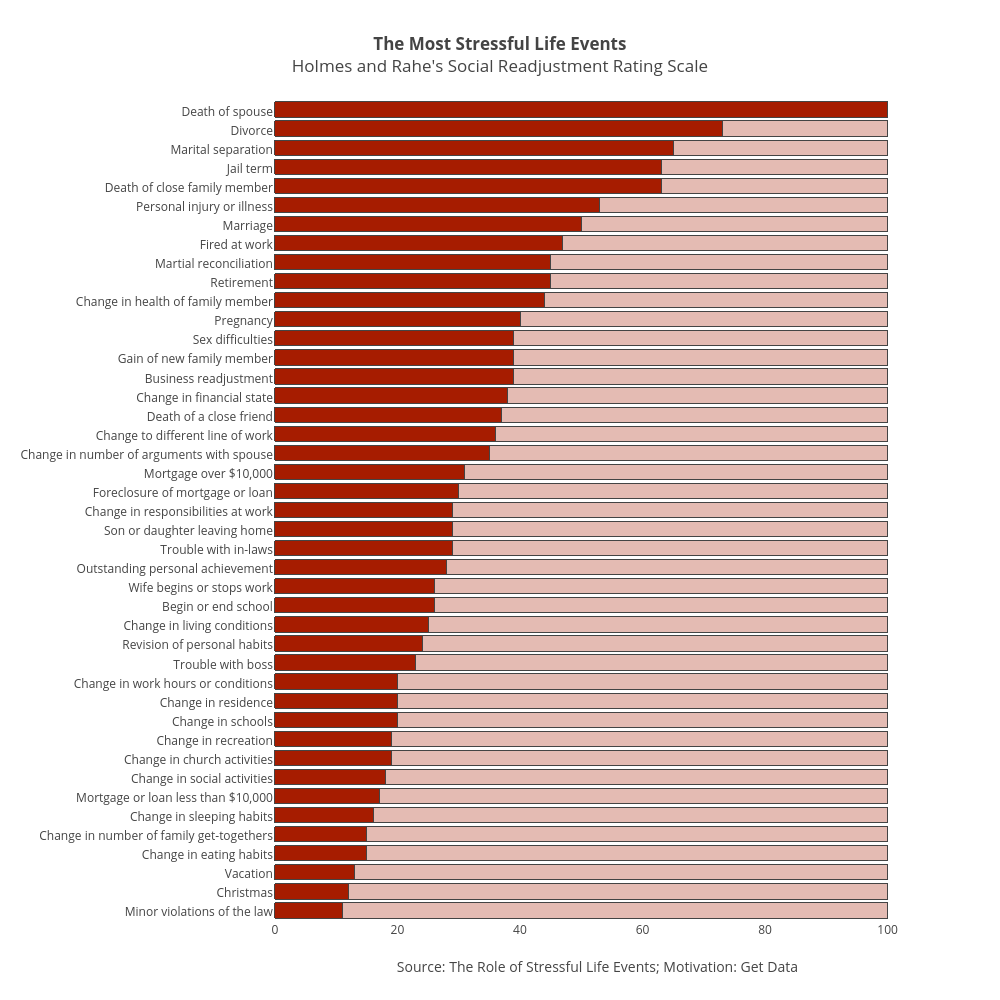
Dreamshot's interactive graph and data of "The Most Stressful Life EventsHolmes and Rahe's Social Readjustment Rating Scale" is a stacked bar chart, showing SRRS vs Col3; with Source: The Role of Stressful Life Events; Motivation: Get Data in the x-axis. The x-axis shows values from 0 to 105.26315789473684. The y-axis shows values from -0.5 to 42.5.