Edit chart
Loading graph
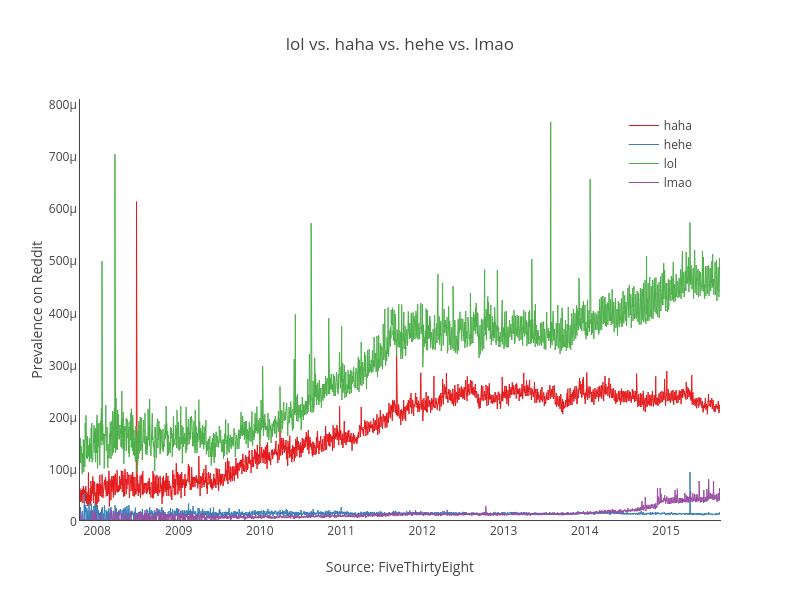
Dreamshot's interactive graph and data of "lol vs. haha vs. hehe vs. lmao" is a scatter chart, showing haha, hehe, lol, lmao; with Source: FiveThirtyEight in the x-axis and Prevalence on Reddit in the y-axis.. The x-axis shows values from 1192359600000 to 1440936000000. The y-axis shows values from 0 to 0.0008060795429926099.