Edit chart
Loading graph
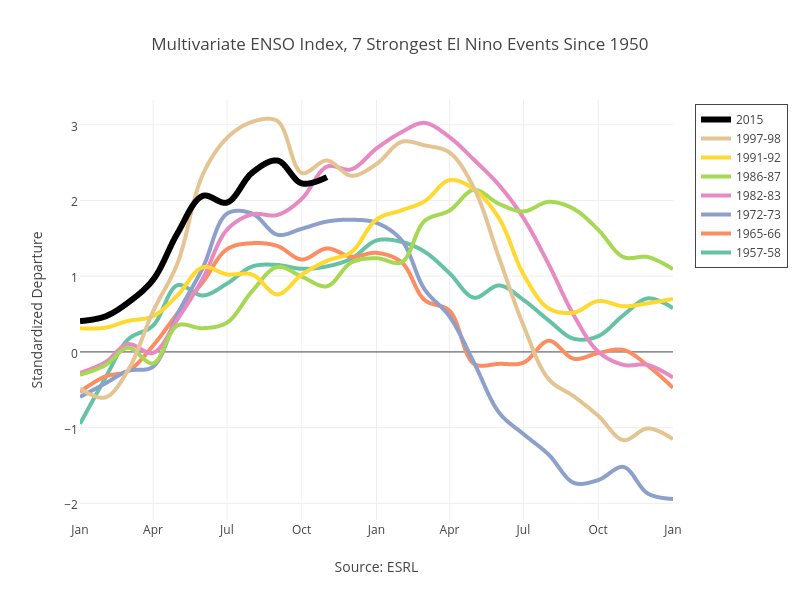
Dreamshot's interactive graph and data of "Multivariate ENSO Index, 7 Strongest El Nino Events Since 1950" is a line chart, showing 1957-58, 1965-66, 1972-73, 1982-83, 1986-87, 1991-92, 1997-98, 2015; with Source: ESRL in the x-axis and Standardized Departure in the y-axis.. The x-axis shows values from -410209200000 to -347137200000. The y-axis shows values from -2.2192777777777777 to 3.326277777777778.