Edit chart
Loading graph
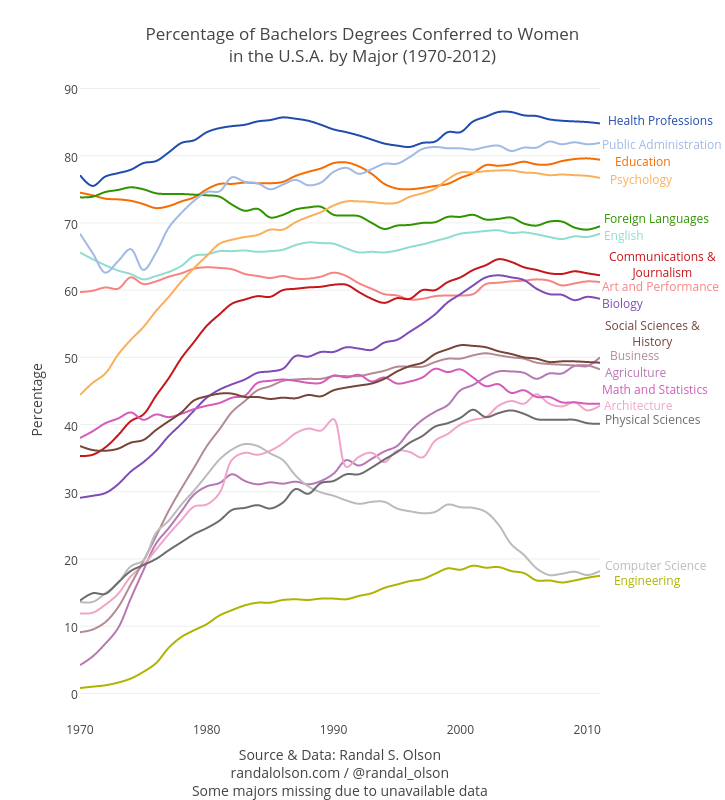
Dreamshot's interactive graph and data of "Percentage of Bachelors Degrees Conferred to Womenin the U.S.A. by Major (1970-2012)" is a scatter chart, showing Agriculture, Architecture, Art and Performance, Biology, Business, Communications and Journalism, Computer Science, Education, Engineering, English, Foreign Languages, Health Professions, Math and Statistics, Physical Sciences, Psychology, Public Administration, Social Sciences and History; with Source & Data: Randal S. Olsonrandalolson.com / @randal_olsonSome majors missing due to unavailable data in the x-axis and Percentage in the y-axis.. The x-axis shows values from 1970 to 2011. The y-axis shows values from -3.9611111111111112 to 91.2611111111111. This visualization has the following annotations: Health Professions; Public Administration; Education; Psychology; Foreign Languages; English; Communications &Journalism; Art and Performance; Biology; Agriculture; Social Sciences &History; Business; Math and Statistics; Architecture; Physical Sciences; Computer Science; Engineering