Edit chart
Loading graph
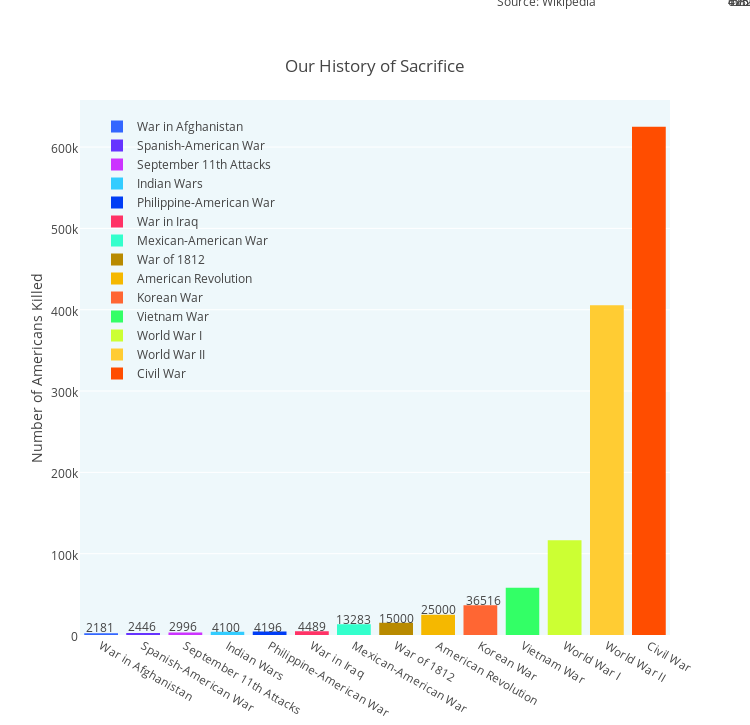
Dreamshot's interactive graph and data of "Our History of Sacrifice" is a grouped bar chart, showing War in Afghanistan, Spanish-American War, September 11th Attacks, Indian Wars, Philippine-American War, War in Iraq, Mexican-American War, War of 1812, American Revolution, Korean War, Vietnam War, World War I, World War II, Civil War; with Number of Americans Killed in the y-axis. The x-axis shows values from -0.5 to 13.5. The y-axis shows values from 0 to 657894.7368421053. This visualization has the following annotations: 2181; 2446; 2996; 4100; 4196; 4489; 13283; 15000; 25000; 36516; 58209; 116516; 405399; 625000; Source: Wikipedia