Edit chart
Loading graph
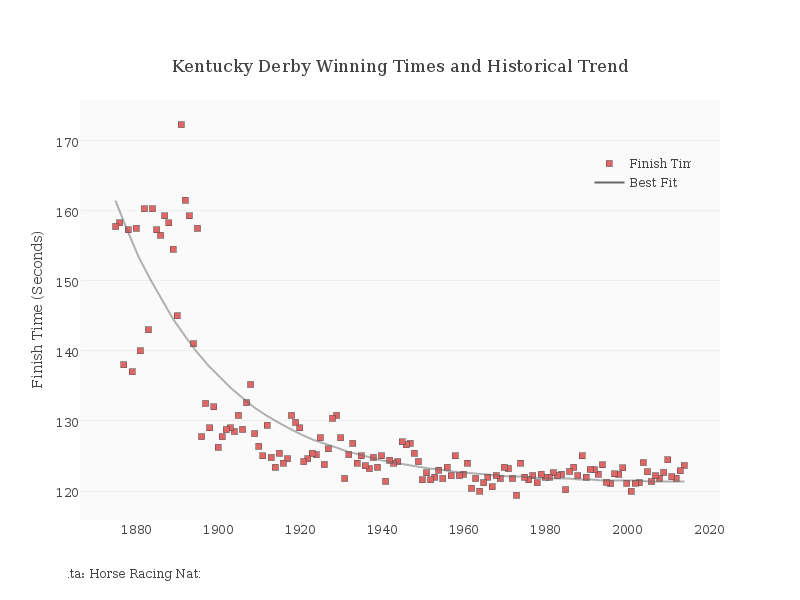
Dreamshot's interactive graph and data of "Kentucky Derby Winning Times and Historical Trend" is a scatter chart, showing Finish Time vs Best Fit; with Finish Time (Seconds) in the y-axis. The x-axis shows values from 1866.259014951627 to 2022.740985048373. The y-axis shows values from 115.86953441295547 to 175.78046558704455. This visualization has the following annotation: Data: Horse Racing Nation