Edit chart
Loading graph
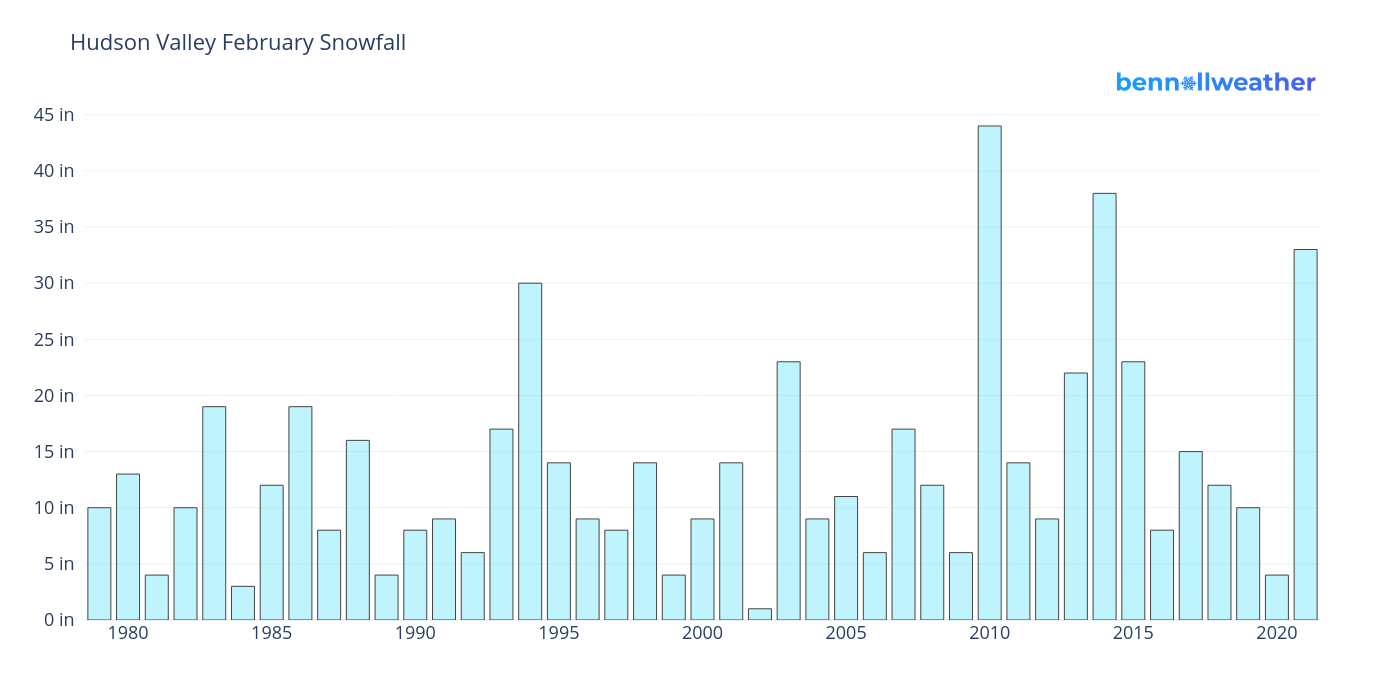
Dreamshot's interactive graph and data of "Hudson Valley February Snowfall" is a bar chart. The x-axis shows values from 1978.5 to 2021.5. The y-axis shows values from 0 to 46.31578947368421.