Edit chart
Loading graph
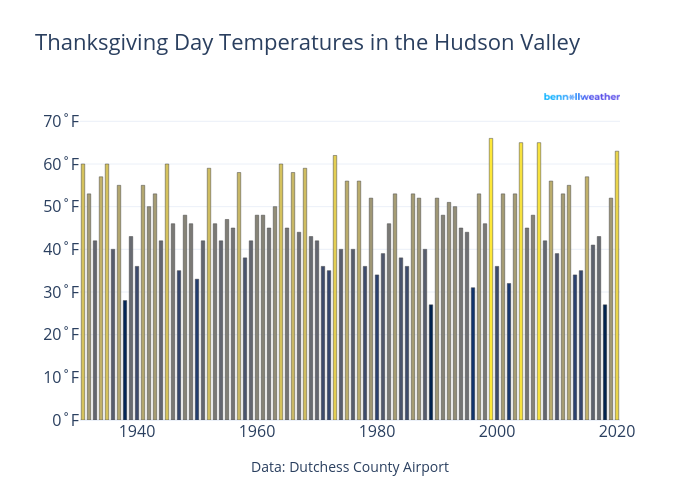
Dreamshot's interactive graph and data of "Thanksgiving Day Temperatures in the Hudson Valley" is a bar chart; with Data: Dutchess County Airport in the x-axis. The x-axis shows values from 1930.5 to 2020.5. The y-axis shows values from 0 to 75.