Edit chart
Loading graph
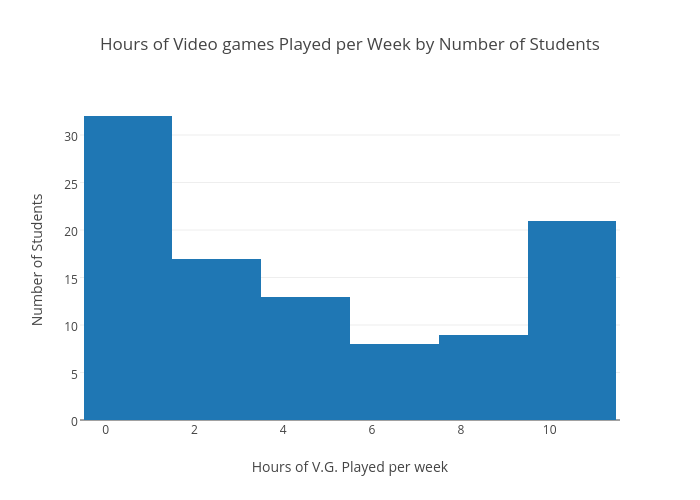
Donkey's interactive graph and data of "Hours of Video games Played per Week by Number of Students" is a histogram, showing labels; with Hours of V.G. Played per week in the x-axis and Number of Students in the y-axis.. The x-axis shows values from -0.579385617095463 to 11.580383132702943. The y-axis shows values from 0 to 33.68421052631579.