Edit chart
Loading graph
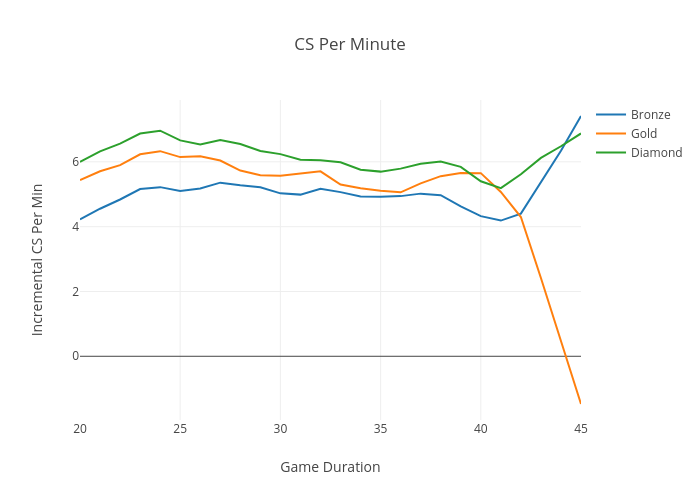
Datallama's interactive graph and data of "CS Per Minute" is a line chart, showing Bronze, Gold, Diamond; with Game Duration in the x-axis and Incremental CS Per Min in the y-axis.. The x-axis shows values from 0 to 0. The y-axis shows values from 0 to 0.