Edit chart
Loading graph
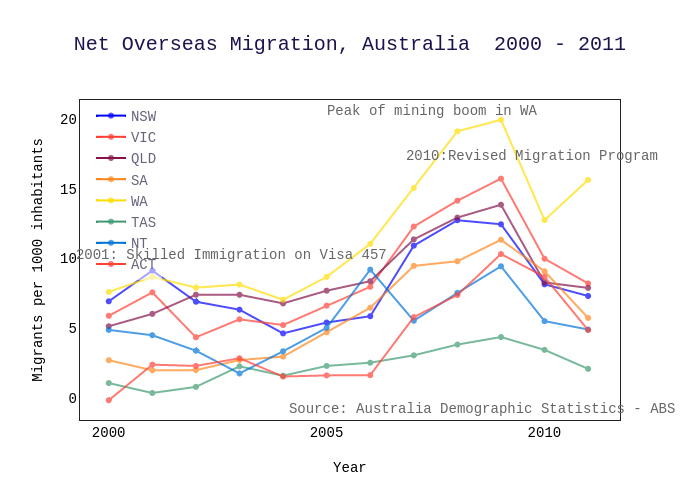
Chloetran's interactive graph and data of "Net Overseas Migration, Australia 2000 - 2011" is a scatter chart, showing NSW, VIC, QLD, SA, WA, TAS, NT, ACT; with Year in the x-axis and Migrants per 1000 inhabitants in the y-axis.. The x-axis shows values from 1999.3399999999992 to 2011.7314769079912. The y-axis shows values from -1.6442556508183945 to 21.124255650818395. This visualization has the following annotations: 2010:Revised Migration Program; Peak of mining boom in WA; 2001: Skilled Immigration on Visa 457; Source: Australia Demographic Statistics - ABS