Edit chart
Loading graph
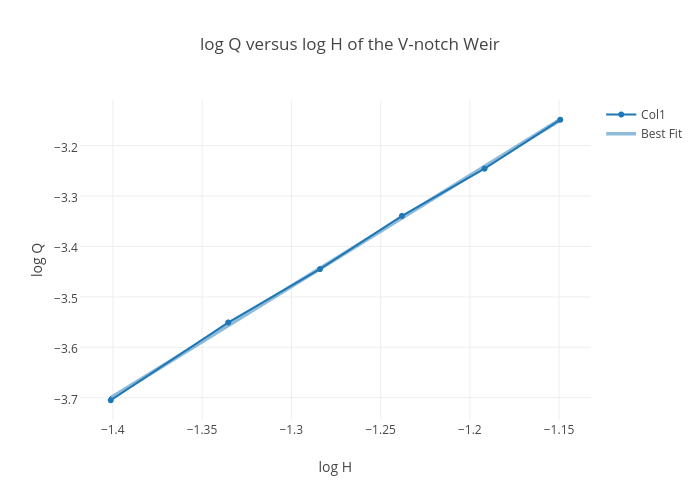
Chaunceylaw's interactive graph and data of "log Q versus log H of the V-notch Weir" is a scatter chart, showing Col1 vs Best Fit; with log H in the x-axis and log Q in the y-axis.. The x-axis shows values from -1.417119744999415 to -1.133480255000585. The y-axis shows values from -3.7420911880409125 to -3.111708811959087.