Edit chart
Loading graph
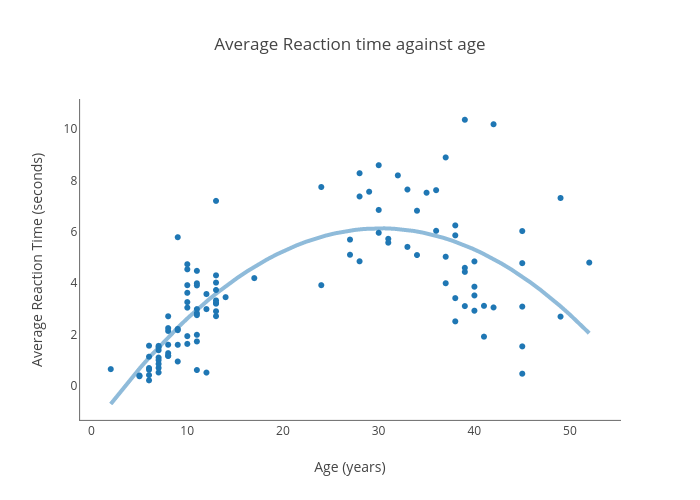
Chantelle's interactive graph and data of "Average Reaction time against age" is a scatter chart, showing Average #2 vs Average #2 - fit; with Age (years) in the x-axis and Average Reaction Time (seconds) in the y-axis.. The x-axis shows values from -1.3316182145613582 to 55.33161821456136. The y-axis shows values from -1.3954719504781705 to 11.05092665729647.