Edit chart
Loading graph
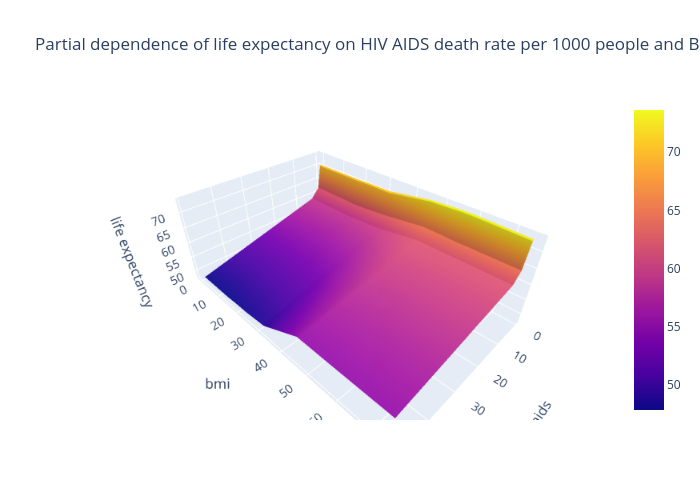
Ch00m's interactive graph and data of "Partial dependence of life expectancy on HIV AIDS death rate per 1000 people and Body Mass Index" is a surface. The x-axis shows values from 0 to 0. The y-axis shows values from 0 to 0.