Edit chart
Loading graph
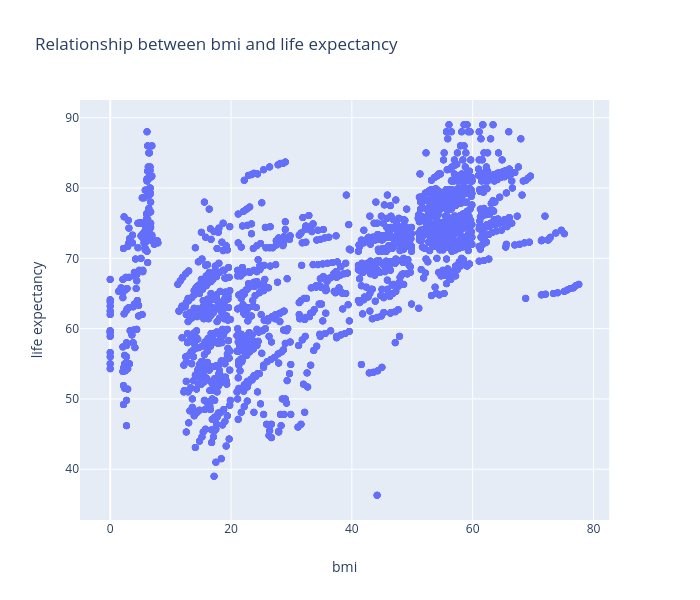
Ch00m's interactive graph and data of "Relationship between bmi and life expectancy" is a scattergl; with bmi in the x-axis and life expectancy in the y-axis.. The x-axis shows values from 0 to 0. The y-axis shows values from 0 to 0.