Edit chart
Loading graph
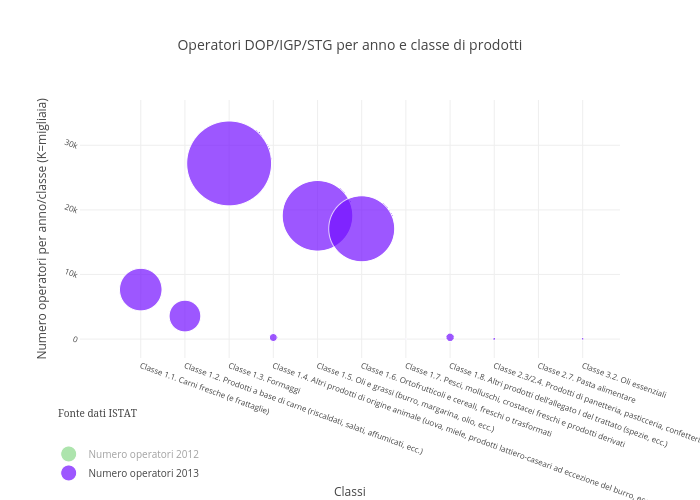
Carloz's interactive graph and data of "Operatori DOP/IGP/STG per anno e classe di prodotti" is a scatter chart, showing Numero operatori 2012 vs Numero operatori 2013; with Classi in the x-axis and Numero operatori per anno/classe (K=migliaia) in the y-axis.. The x-axis shows values from -1.3748869408215008 to 10.845411021245887. The y-axis shows values from -2850.476727001257 to 36003.773897371786. This visualization has the following annotation: Fonte dati ISTAT