Edit chart
Loading graph
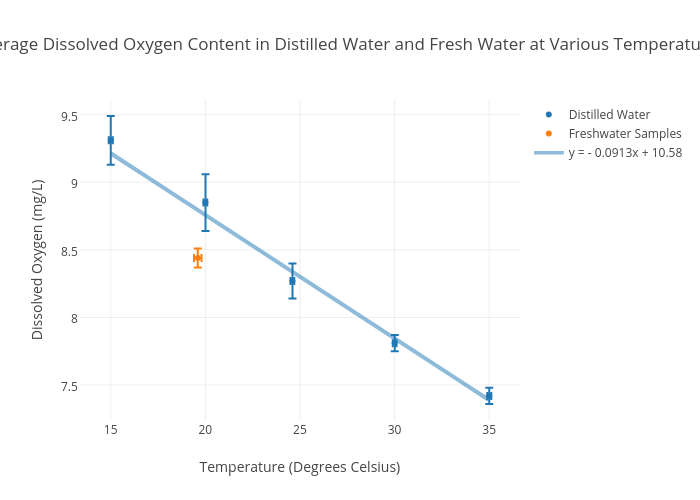
Calliekeen's interactive graph and data of "Average Dissolved Oxygen Content in Distilled Water and Fresh Water at Various Temperatures" is a scatter chart, showing Distilled Water, Freshwater Samples, y = - 0.0913x + 10.58; with Temperature (Degrees Celsius) in the x-axis and Dissolved Oxygen (mg/L) in the y-axis.. The x-axis shows values from 13.777777777777779 to 36.22222222222222. The y-axis shows values from 7.241666666666667 to 9.608333333333334.