Edit chart
Loading graph
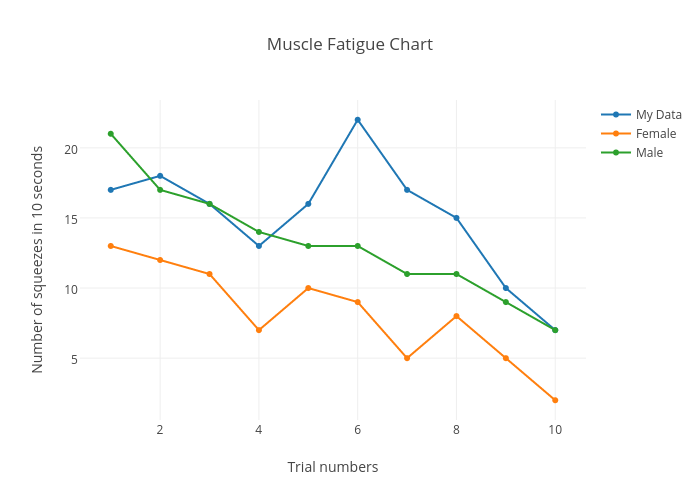
Bradonbuss's interactive graph and data of "Muscle Fatigue Chart " is a scatter chart, showing My Data, Female, Male; with Trial numbers in the x-axis and Number of squeezes in 10 seconds in the y-axis.. The x-axis shows values from 0.42596810933940765 to 10.574031890660592. The y-axis shows values from 0.5416666666666667 to 23.458333333333332.