Edit chart
Loading graph
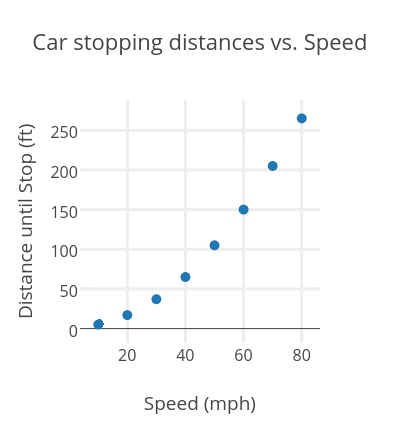
Biggermath's interactive graph and data of "Car stopping distances vs. Speed" is a scatter chart, showing Distance until Stop (ft); with Speed (mph) in the x-axis and Distance until Stop (ft) in the y-axis.. The x-axis shows values from 3.722358722358722 to 86.27764127764128. The y-axis shows values from -18.2007759456838 to 288.2007759456838.