Edit chart
Loading graph
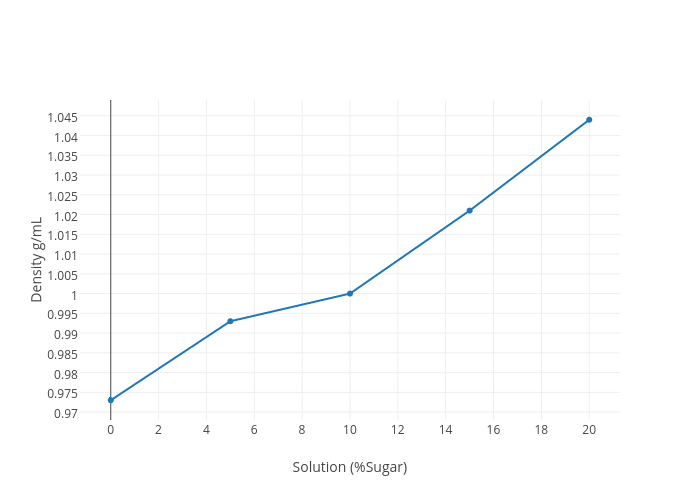
Badamanda's interactive graph and data of "Density g/mL vs Solution (%Sugar) " is a scatter chart, showing Col2; with Solution (%Sugar) in the x-axis and Density g/mL in the y-axis.. The x-axis shows values from -1.2432603869330798 to 21.24326038693308. The y-axis shows values from 0.9675726817042606 to 1.0494273182957394.