Edit chart
Loading graph
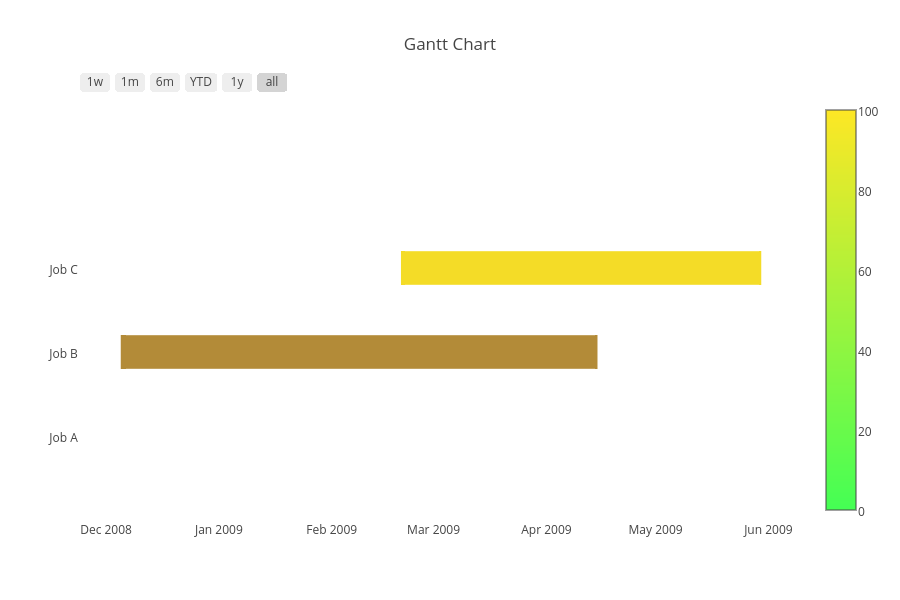
Adamkulidjian's interactive graph and data of "Gantt Chart" is a scatter chart, showing , , , ; with time in the x-axis. The x-axis shows values from 0 to 0. The y-axis shows values from -1 to 4.