Edit chart
Loading graph
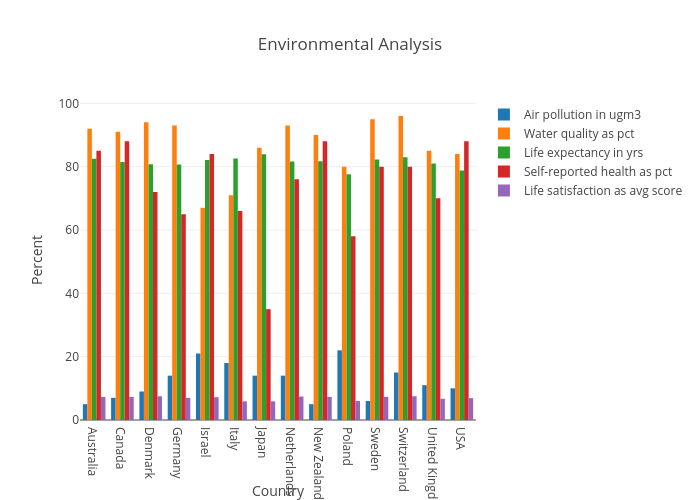
Aakashshah's interactive graph and data of "Environmental Analysis" is a bar chart, showing Air pollution in ugm3, Water quality as pct, Life expectancy in yrs, Self-reported health as pct, Life satisfaction as avg score; with Country in the x-axis and Percent in the y-axis.. The x-axis shows values from -0.5 to 13.5. The y-axis shows values from 0 to 101.05263157894737.