Edit chart
Loading graph
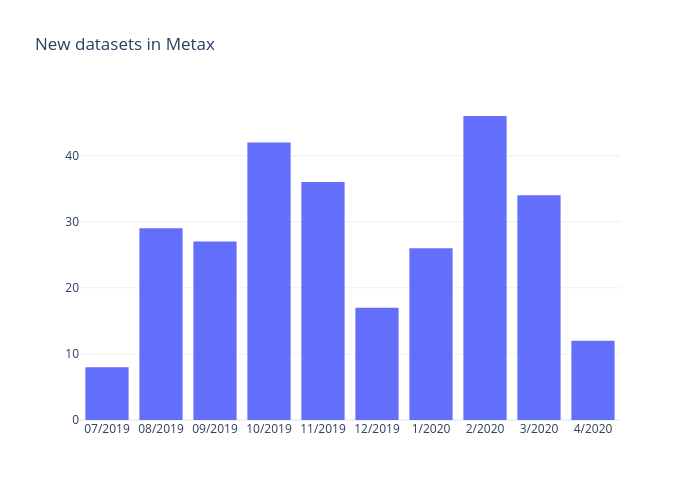
Att's interactive graph and data of "New datasets in Metax" is a bar chart. The x-axis shows values from -0.5 to 15.5. The y-axis shows values from 0 to 48.421052631578945.