Edit chart
Loading graph
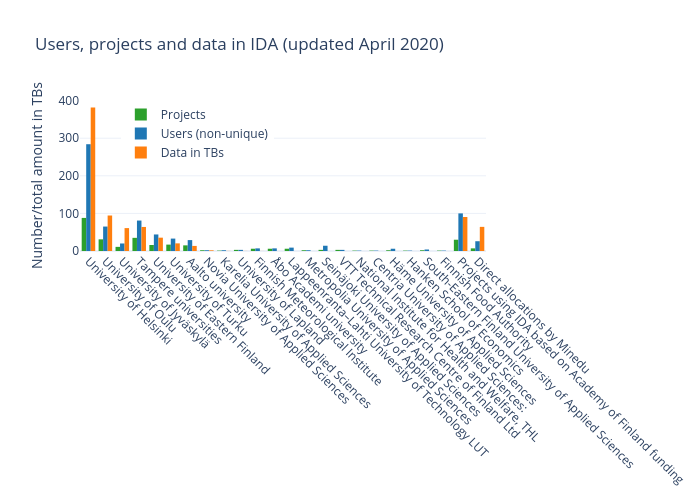
Att's interactive graph and data of "Users, projects and data in IDA (updated April 2020)" is a bar chart, showing Projects, Users (non-unique), Data in TBs; with Number/total amount in TBs in the y-axis. The x-axis shows values from -0.5 to 23.5. The y-axis shows values from 0 to 401.6247430526316.