Edit chart
Loading graph
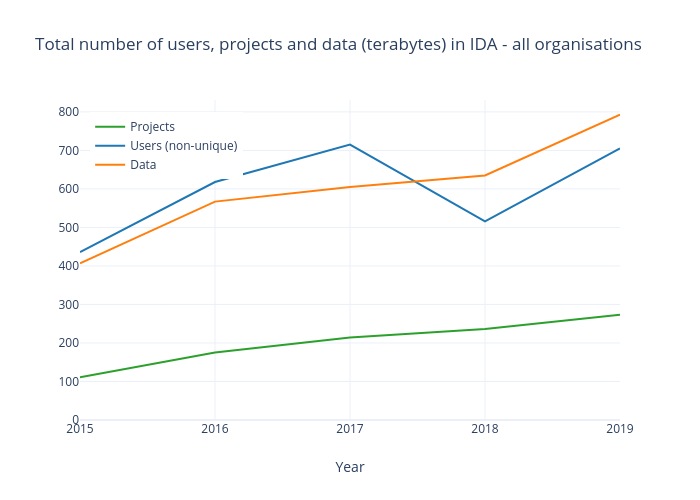
Att's interactive graph and data of "Total number of users, projects and data (terabytes) in IDA - all organisations" is a line chart, showing %{meta.columnNames.y}, Users (non-unique), %{meta.columnNames.y}; with Year in the x-axis. The x-axis shows values from 2015 to 2019. The y-axis shows values from 0 to 830.8888888888889.