Edit chart
Loading graph
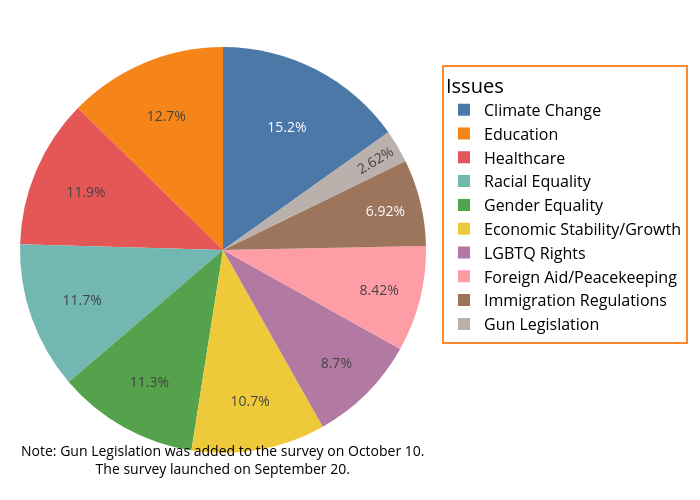
Area11's interactive graph and data is a pie. The x-axis shows values from -1 to 6. The y-axis shows values from -1 to 4. This visualization has the following annotation: Note: Gun Legislation was added to the survey on October 10.The survey launched on September 20.