Edit chart
Loading graph
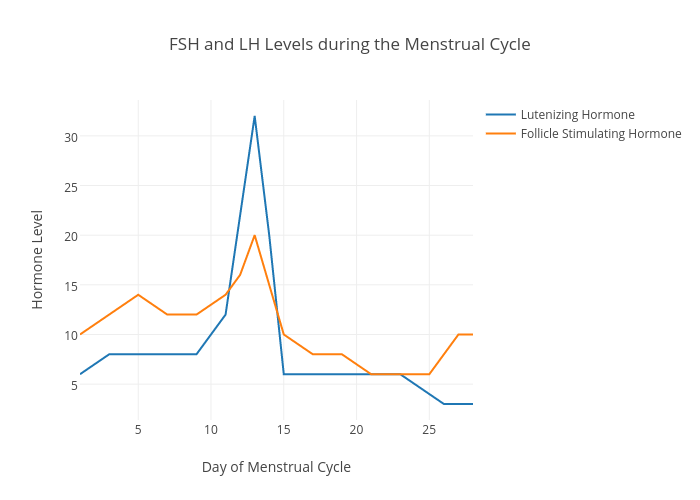
Ambio's interactive graph and data of "FSH and LH Levels during the Menstrual Cycle" is a scatter chart, showing Lutenizing Hormone vs Follicle Stimulating Hormone; with Day of Menstrual Cycle in the x-axis and Hormone Level in the y-axis.. The x-axis shows values from 1 to 28. The y-axis shows values from 1.3888888888888886 to 33.611111111111114.