Edit chart
Loading graph
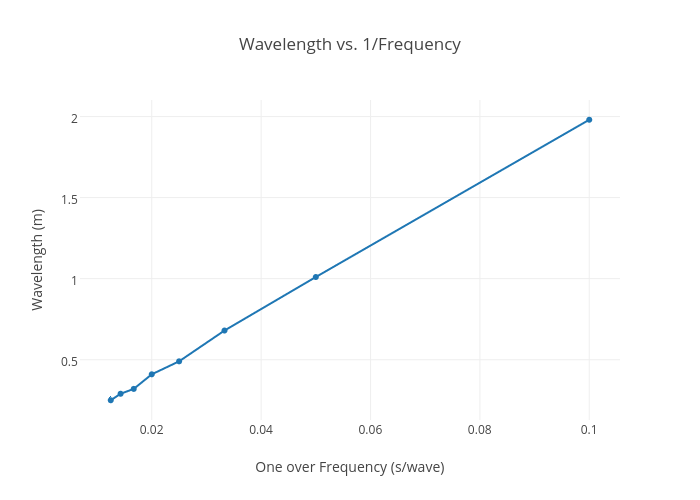
Aeschbacher1's interactive graph and data of "Wavelength vs. 1/Frequency" is a scatter chart, showing Col2; with One over Frequency (s/wave) in the x-axis and Wavelength (m) in the y-axis.. The x-axis shows values from 0.0070607358071677765 to 0.10543926419283223. The y-axis shows values from 0.1269820828667413 to 2.1030179171332586.