Edit chart
Loading graph
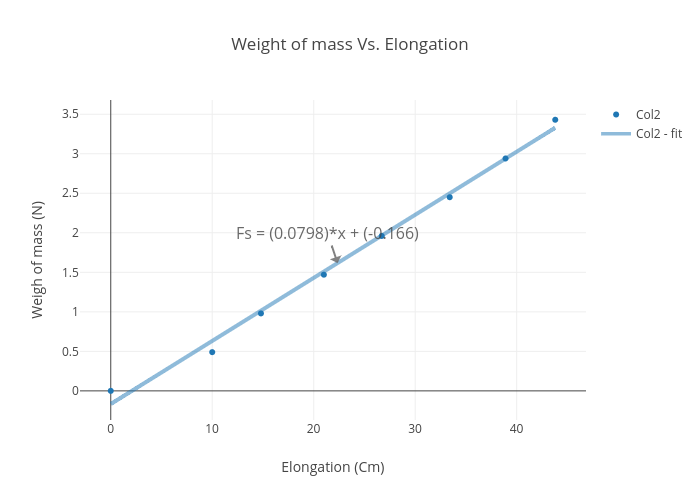
509561's interactive graph and data of "Weight of mass Vs. Elongation" is a scatter chart, showing Col2 vs Col2 - fit; with Elongation (Cm) in the x-axis and Weigh of mass (N) in the y-axis.. The x-axis shows values from -2.6615153788447112 to 46.46151537884471. The y-axis shows values from -0.36889810039403936 to 3.686306036091235. This visualization has the following annotation: Fs = (0.0798)*x + (-0.166)