Edit chart
Loading graph
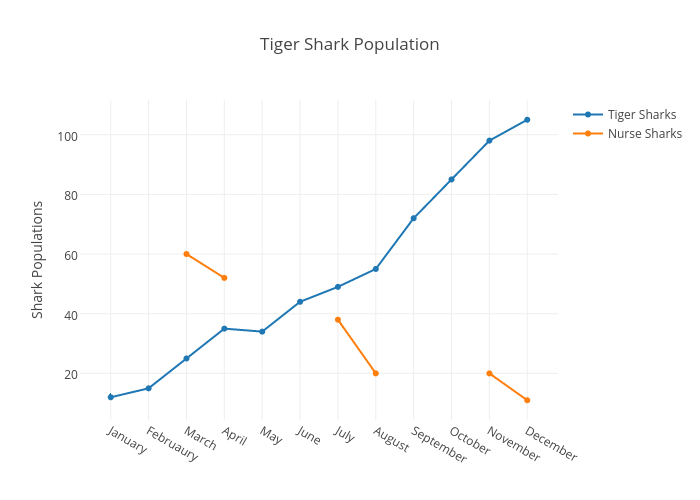
2fab4you's interactive graph and data of "Tiger Shark Population" is a scatter chart, showing Tiger Sharks vs Nurse Sharks; with Shark Populations in the y-axis. The x-axis shows values from -0.7091963995228284 to 11.709196399522828. The y-axis shows values from 4.753008895866039 to 111.24699110413397.