Edit chart
Loading graph
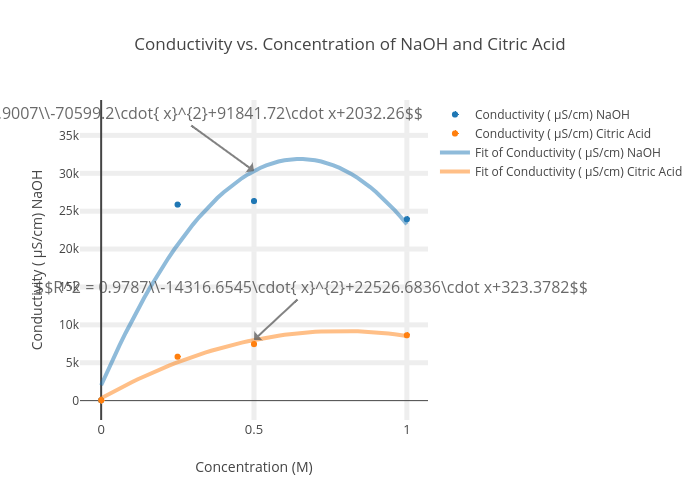
191browdyl's interactive graph and data of "Conductivity vs. Concentration of NaOH and Citric Acid" is a scatter chart, showing Conductivity ( μS/cm) NaOH vs Conductivity ( μS/cm) Citric Acid; with Concentration (M) in the x-axis and Conductivity ( μS/cm) NaOH in the y-axis.. The x-axis shows values from -0.06379821958456973 to 1.0637982195845697. The y-axis shows values from -2608.692867724808 to 40932.491470898545. This visualization has the following annotations: $$R^2 = 0.9007\\-70599.2\cdot{ x}^{2}+91841.72\cdot x+2032.26$$; $$R^2 = 0.9787\\-14316.6545\cdot{ x}^{2}+22526.6836\cdot x+323.3782$$