Edit chart
Loading graph
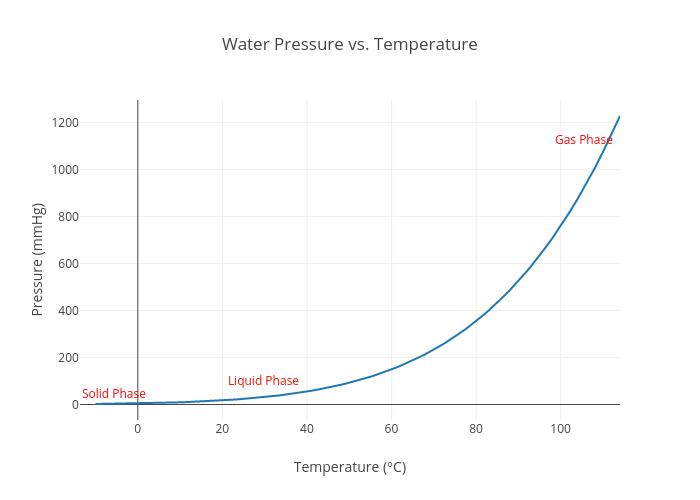
18youngt's interactive graph and data of "Water Pressure vs. Temperature" is a line chart, showing B; with Temperature (°C) in the x-axis and Pressure (mmHg) in the y-axis.. The x-axis shows values from -11.357045143638846 to 114. The y-axis shows values from -65.95 to 1295.05. This visualization has the following annotations: Solid Phase; Liquid Phase; Gas Phase