Edit chart
Loading graph
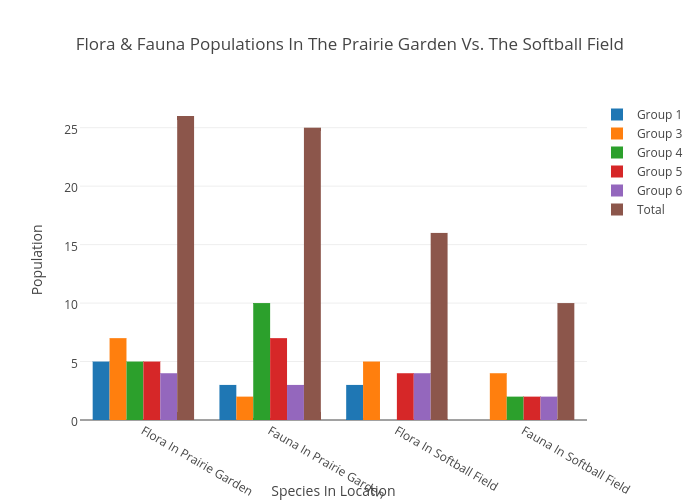
181prestonk's interactive graph and data of "Flora & Fauna Populations In The Prairie Garden Vs. The Softball Field" is a bar chart, showing Group 1, Group 3, Group 4, Group 5, Group 6, Total; with Species In Location in the x-axis and Population in the y-axis.. The x-axis shows values from -0.5 to 3.5. The y-axis shows values from 0 to 27.36842105263158.